
Turning Information Into Measurable Impact
Every automation project lives or dies by its data. At 3 Dot Digital, we make sure your business decisions are powered by clean, connected, and reliable insights — not guesswork.
Data & Insights is a core component of our work because you can't improve what you can't measure. From collection and cleaning through to analysis and visualisation, we give leaders the clarity to track ROI, prove impact, and steer the business forward.
The Data Challenges Leaders Face
Scattered Systems
Finance in one place, operations in another, and customer data spread across spreadsheets and apps.
Manual Reporting
Staff wasting hours every week wrangling spreadsheets instead of adding value.
Inconsistent Quality
Dirty or duplicated data undermines trust in every report.
Slow Decision-Making
Reports arrive days late, long after opportunities have passed.
No Visibility into ROI
Leaders can't measure the true impact of new tools or initiatives.
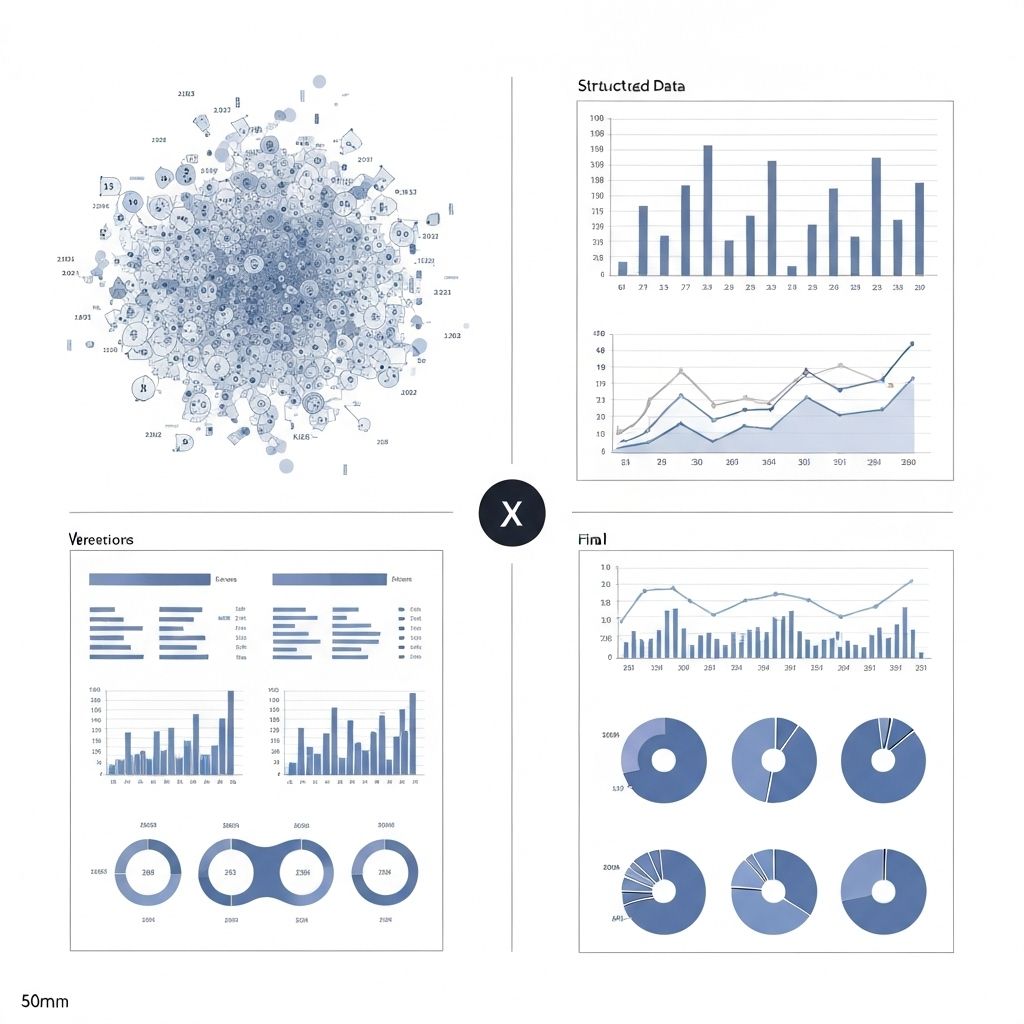
Our Approach: From Raw Data to Actionable Insight

Data Collection
We connect directly to your Line of Business applications, ERPs, CRMs, SaaS platforms, and even unstructured sources like documents and PDFs sitting on SharePoint. APIs, secure ETL pipelines, and RPA ensure nothing falls through the cracks.
Data Cleansing & Transformation
We remove duplicates, resolve inconsistencies, and standardise formats. More importantly, we apply business logic so data isn't just tidy — it's meaningful to your context.

Analysis & Intelligence
Using advanced analytics, machine learning, and AI-driven pattern recognition, we highlight trends, anomalies, and opportunities. This is where insights turn into competitive advantages.
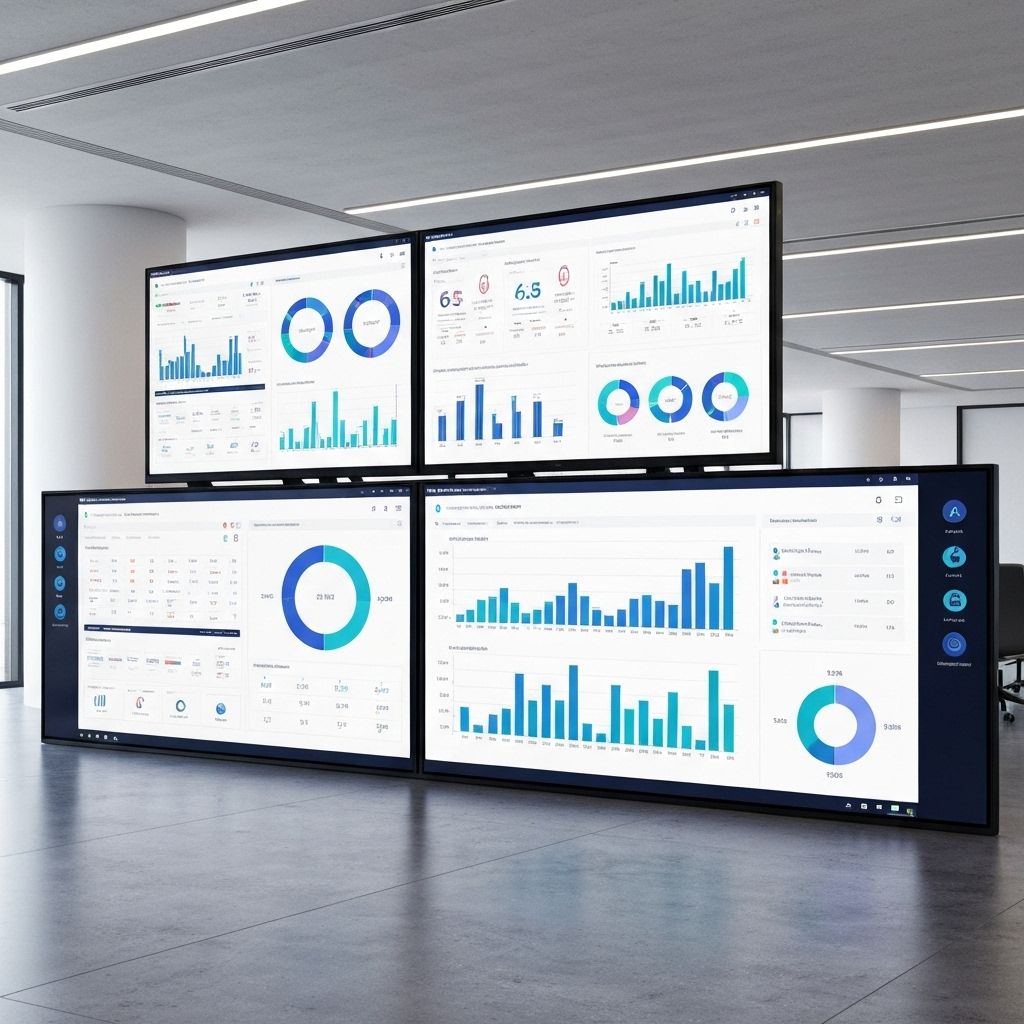
Visualisation & Storytelling
We build dashboards in tools like Power BI, Tableau, Looker, or Custom Dashboards, tailored to your KPIs. Executives get real-time visibility, frontline staff get actionable metrics, and everyone trusts the numbers.
The Data-to-Insight Journey
From raw data to actionable intelligence in four connected steps
Collect
Connect data from ERPs, CRMs, SaaS apps, and legacy systems.
Outcome: No blind spots — leaders see the full picture across the business.
Clean
Remove duplicates, fix errors, and apply business rules.
Outcome: Trusted data that decision-makers can act on with confidence.
Analyse
Apply AI, machine learning, and advanced analytics to reveal trends.
Outcome: Clear answers to where costs, risks, and opportunities lie.
Visualise
Deliver tailored dashboards in Power BI, Tableau, or Looker.
Outcome: Executives and teams make faster, smarter decisions every day.
How 3DD Is Different
Other firms dump dashboards on your desk. We make sure your data actually drives outcomes.
Business-First Metrics
We align every dashboard and report with what matters to leaders: margin, cost-to-serve, cycle time, and customer satisfaction.
Tool-Agnostic Expertise
Whether your stack runs on AWS, Azure, GCP, or on-prem systems, we design pipelines and dashboards that fit your environment, not force you into ours.
Integration with Automation
Because we build automation platforms, your data isn't just reported — it actively powers workflows and decision-making.
Proof of ROI
We bake measurement into every project so you can see the real value delivered, not just pretty charts.
What You Get With 3DD Data & Insights
One source of truth across finance, operations, and customer data
Automated reporting that cuts days of manual work
Real-time dashboards tailored to your leadership priorities
Confidence in compliance with auditable, transparent data trails
Clear measurement of ROI for every automation and platform investment
Faster, smarter decision-making at every level of the organisation
Examples of Data & Analytics in Action
Revenue Forecasting
Professional Services
Automated dashboards combine project pipelines, resource utilisation, and billing data to give leadership a clear forecast of next quarter's revenue — without waiting for finance to crunch spreadsheets.
Outcome: Leaders spot revenue gaps early and adjust strategy proactively.
Project Performance Tracking
AEC & Mining
Data from field systems, schedules, and budgets flows into a single dashboard. Leaders see progress vs plan, cost variance, and safety compliance in real time.
Outcome: Projects stay on track, overruns are caught before they spiral.
Customer Health Monitoring
SaaS & Technology
Data from product usage, support tickets, and billing systems is unified into a customer health score. At-risk accounts trigger alerts for account managers.
Outcome: Churn drops, renewals increase, and customer satisfaction improves.
Financial Close Automation
Finance & Accounting
Transactions from multiple systems are validated, reconciled, and rolled into real-time P&L dashboards.
Outcome: Month-end close cycle shrinks from weeks to days, freeing finance for strategic analysis.